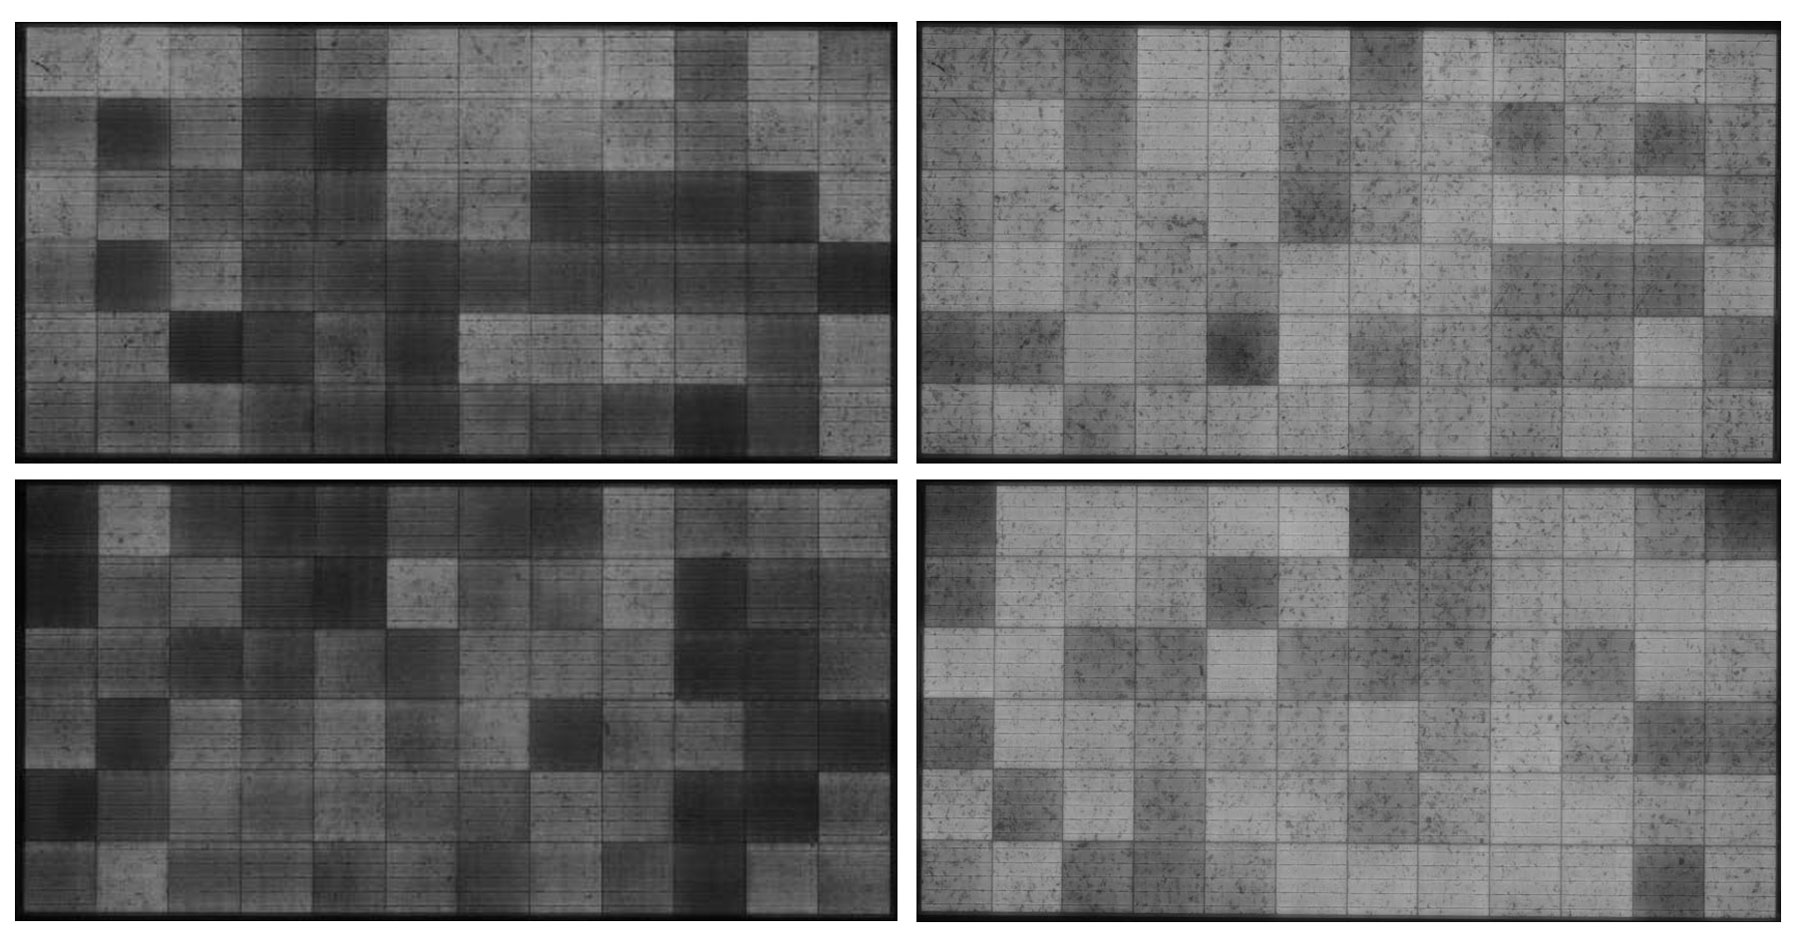
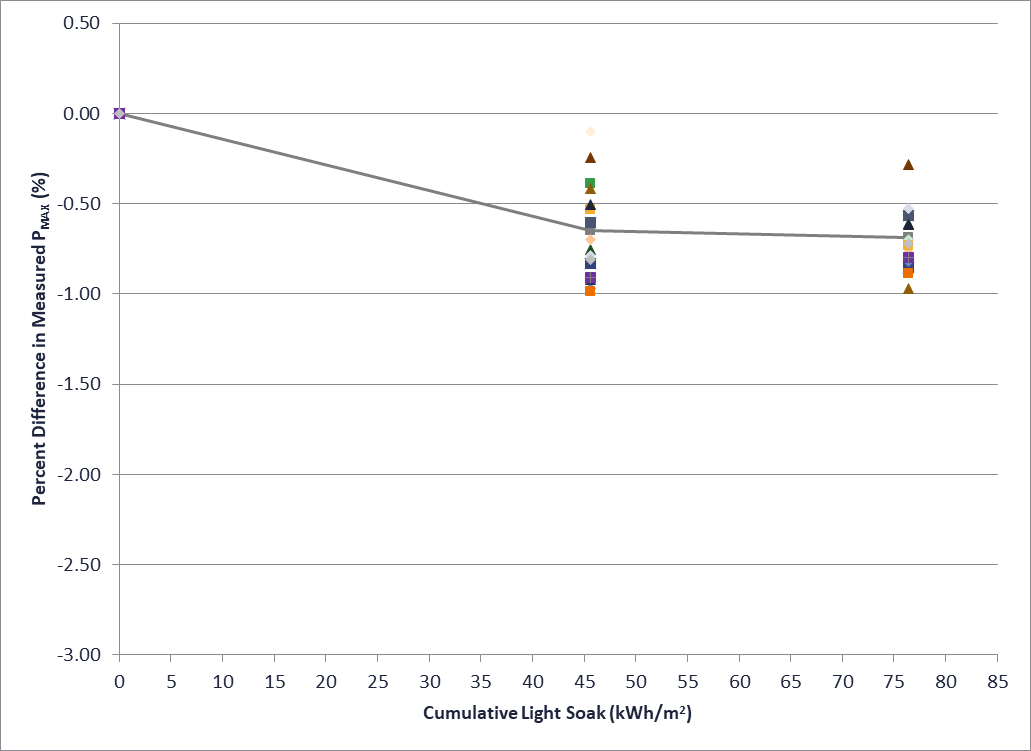
LID + LETID

Why LID + LETID Testing Matters

In 2021, PI Berlin, a member of the Kiwa Group, was contacted regarding underperformance at a >~100 MW solar plant in the MENA region. A review of the site monitoring data, IV curve traces, and O&M records pointed to module-level issues just 18 months after the site became operational.

PI Berlin conducted lab-based testing on 20 modules from the site, 16 of which came from the underperforming section of the array, while the other four samples were of the same model type but from a different section. Flash testing revealed that on average the 16 modules underperformed the manufacturer’s guaranteed power by 6.7%. The average power for the four unaffected modules was 7.8% higher than the average power for the 16 affected modules.

EL images revealed a checkerboarding effect that is common on LETID affected modules. The four unaffected modules did not show this pattern.

PI Berlin performed an LETID test on two of the affected samples, which resulted in a minor power decrease, suggesting that the full LETID power loss had already occurred in the field. An LETID recovery test was then performed, which resulted in an average power increase of 6.1%. Improvements in the uniformity of the EL images indicated a significant LETID recovery. These results proved that LETID was a key factor in the underperformance, and that at least two distinct BOMs of the same model type had been delivered to site: one that was LETID susceptible, and another that was not.

Following Kiwa’s Module Procurement Best Practices including PVEL PQP testing, BOM specification in procurement contracts and batch testing would have greatly reduced the likelihood of LETID susceptible modules being shipped to the site.

EL images from the LETID recovery test. Initial results on the left, post-recovery test on the right. Had there been a different failure mode the LETID recovery test would not have resulted in this change to the EL images.

Cells

Materials Assessed

LID and LETID are entirely cell-based phenomena. PVEL’s test results indicate that no other materials impact these degradation modes.

  • Cells
Explore PVEL’s Test Methodology
Key Takeaways
Scroll through the key takeaways.

97% of BOMs tested had less than 2% power loss.

LID + LETID results had a 0.8% median and 0.7% average, with 71% of BOMs having less than 1% degradation after LID and LETID. Given these results, PVEL is considering raising the Top Performer threshold for this test in future Scorecards.

100% of PERC BOMs in the 2023 Scorecard test population were doped with gallium.

Across the historical PQP test population, gallium-doped PERC modules have 0.7% median and average degradation following LID and LETID. This compares to a 0.9% median and 1.2% average for historical boron-doped PERC.

Non-PERC cell technologies outperformed.

The average LID + LETID power loss across CdTe, n-type TOPCon and n-type HJT BOMs was 0.0% and the median was 0.2%, showing that these technologies are generally not susceptible to these degradation modes.

Pre-stress testing failures continue to be problematic.

Placing modules outdoors for light-soaking during LID testing led to a surprising amount of failures including power labels peeling off and junction box lids dislodging. LETID testing also caused two BOMs to experience wet leakage failures.

Test Procedure

To measure LID, PVEL installs a statistically significant sample of 17 modules outdoors, connected to an inverter and exposed to repeated rounds of light soaking and flash testing until stability is reached per the IEC 61215 criterion.

To measure LETID, two of the post-LID modules are placed in an environmental chamber at 75°C while a low current is injected for 486 hours. This current level simulates operation in full sun at maximum power point. Modules undergo flash testing and EL imaging every 162 hours. The test protocol is designed to slowly approach the maximum LETID rate and not instigate the recovery process or activate other degradation modes.

Power Degradation of Each Model Type

LETID testing was introduced into the PQP in 2019.

View Box Plot Interpretation Guide

See Top
Performers

Click here to see the 218 model types listed as LID+LETID Top Performers

LID Test Result Spotlight

The benefits of gallium doping and process improvement are clearly shown in this example of LID results from two PQPs tested within a sixmonth period from the same module and cell manufacturer. Despite both reportedly being galliumdoped PERC cells, the average LID was 1.45% on the first BOM, a result more typical of borondoped PERC. Six months later the manufacturer had tuned their gallium cell dopant process and their average LID was reduced by more than half.

LID - First BOM

Light soak to stabilization results for one BOM showing an average LID of 1.45%.

LID - Second BOM

Light soak to stabilization results from the same manufacturer six months later showing an
average LID of 0.69%.

Go beyond model types. Procure PV modules with top-performing bills of materials.

Join PVEL’s downstream partner network.

Sign Up

Continue Exploring the 2023 Scorecard