Potential-induced degradation (PID) is triggered by high PV system voltages on ungrounded installations. PID is more likely to occur in projects that use transformerless inverters, and is further accelerated by high-temperature and high-humidity environments. While PID is sometimes reversible, severe and permanent PID can lower energy yield by as much as 30%.
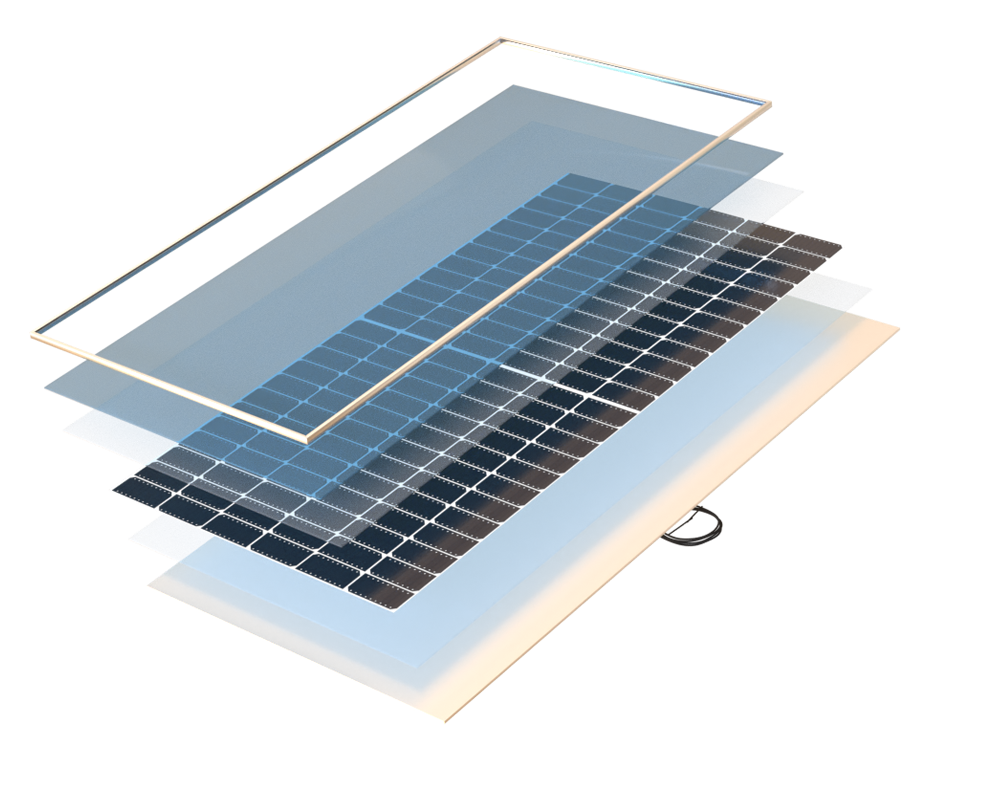
PID can occur within weeks of commissioning. It generally happens when there is a negative voltage between a PV module’s frame and cells that causes sodium ions in the module’s glass to migrate into the cells, which are typically coated with a silicon nitride (SiN) anti-reflective coating. In PID-susceptible cells, pinholes in the SiN coating are large enough to allow sodium ions to enter the cell, creating “shunts.” This can cause module performance to be irreparably decreased. Alternatively, a possibly reversible form of PID can occur when the voltage of the PV module’s internal circuit relative to ground creates a buildup of static charge, also causing power loss.